
The numbers behind the platform.
Sol AI reads 636 solar systems — 21 MW across 18 inverter brands — in production today. Every figure on this page carries its exact value, its source, and its measurement window, verified against the production database, so you can judge the platform on what it actually does.
The numbers
Every claim, its exact figure, and where it came from.
Measurement window Feb 26 – Jul 19, 2026 unless a row states otherwise. The platform has run in production for over a year; this is the span the audit covered.
| Claim | Exact figure | Source |
|---|---|---|
| Median first response to every lead | 23s (p90 31s) | n=4,019 first-response intervals, message tables, Feb 26 – Jul 19, 2026, zero trimming |
| After-hours leads served identically | 55.65% of leads after-hours; ≤60s reply 94.4% vs 94.5% in-hours | 2,336 vs 1,862 leads |
| Conversations with zero human keystrokes | 95.05% | 3,990 of 4,198, measured as no human-typed outgoing message |
| AI-closed contracts | 27 contracts, Rs 49.2M (~$174K), first 5 months | signed-contract records; ramp 3→10→11 deals/mo Apr–Jun |
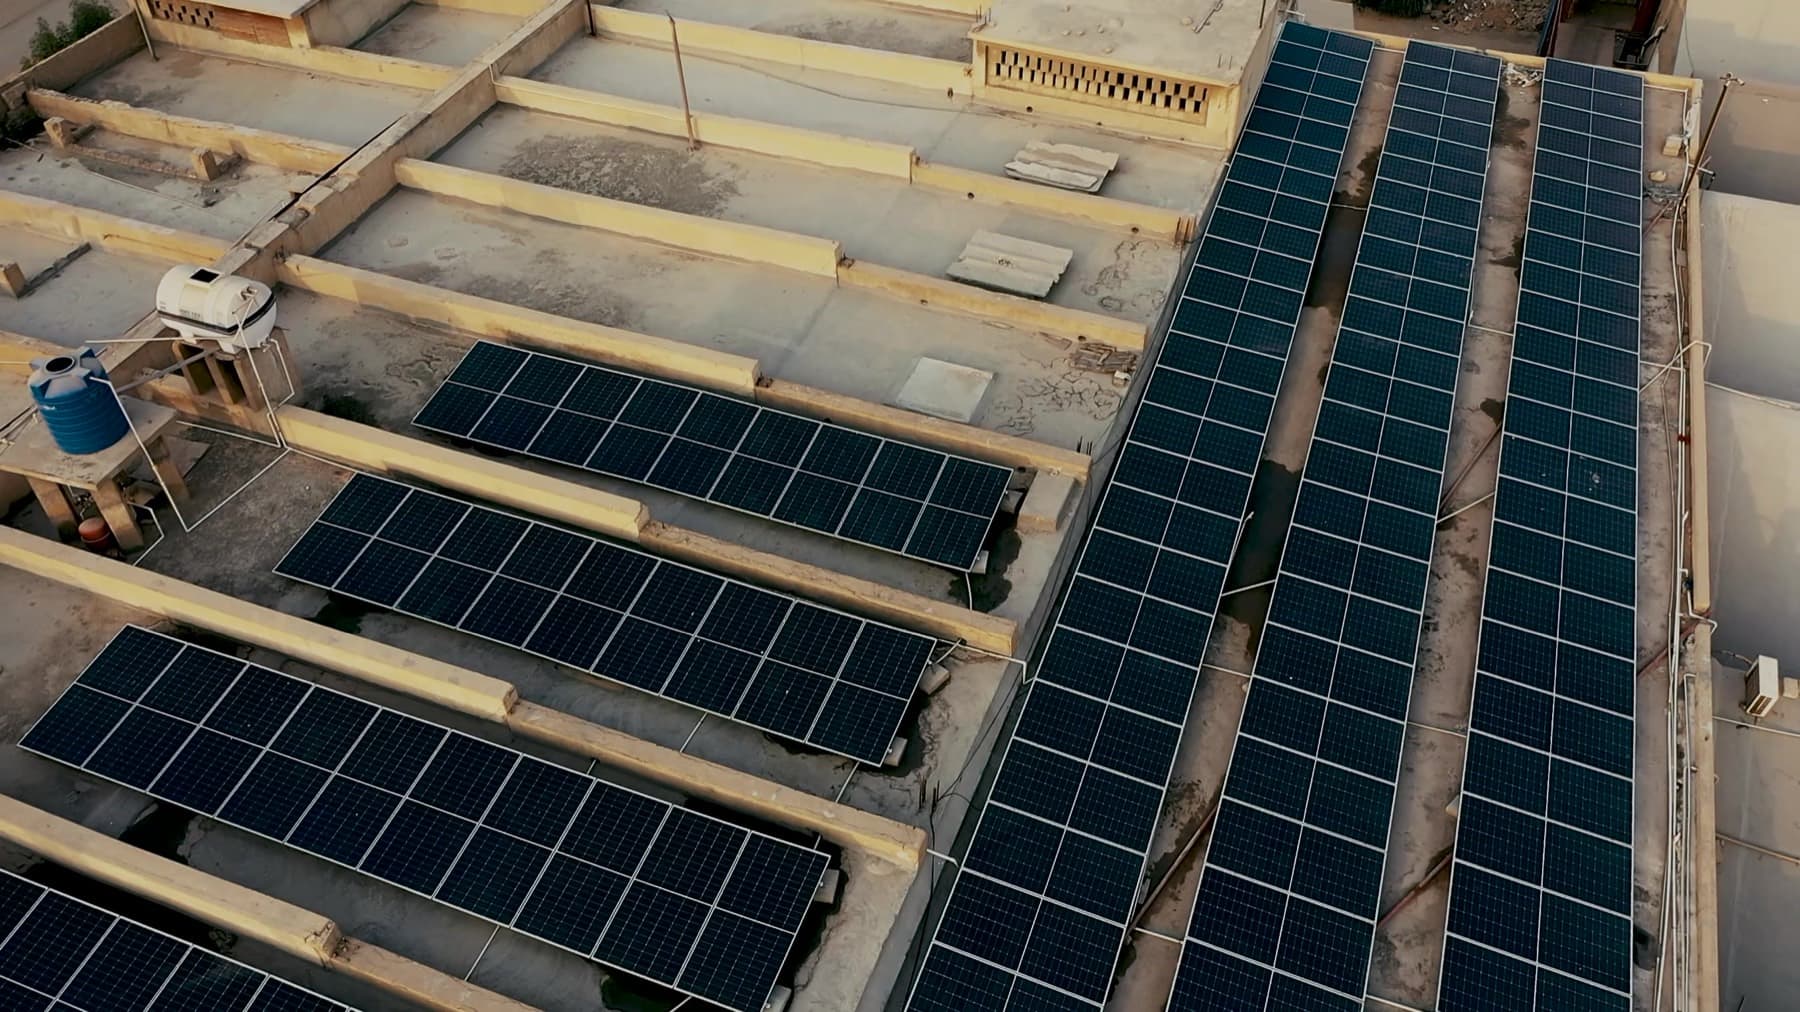
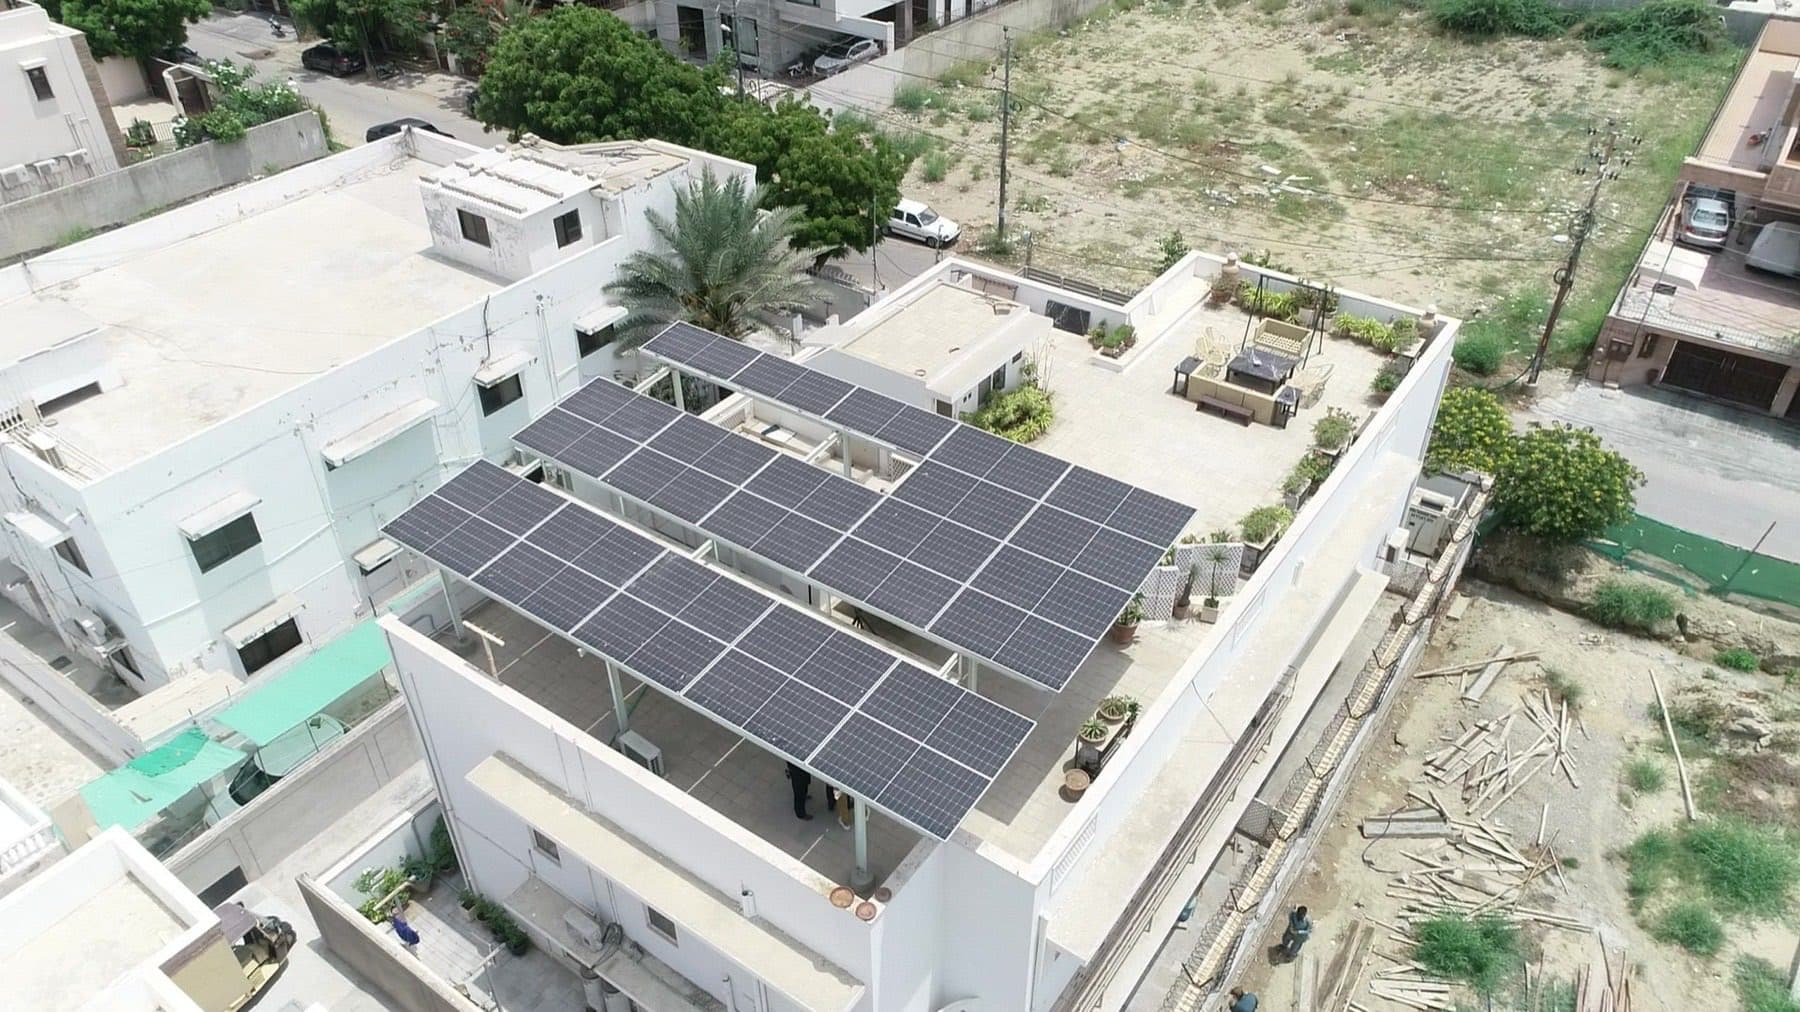
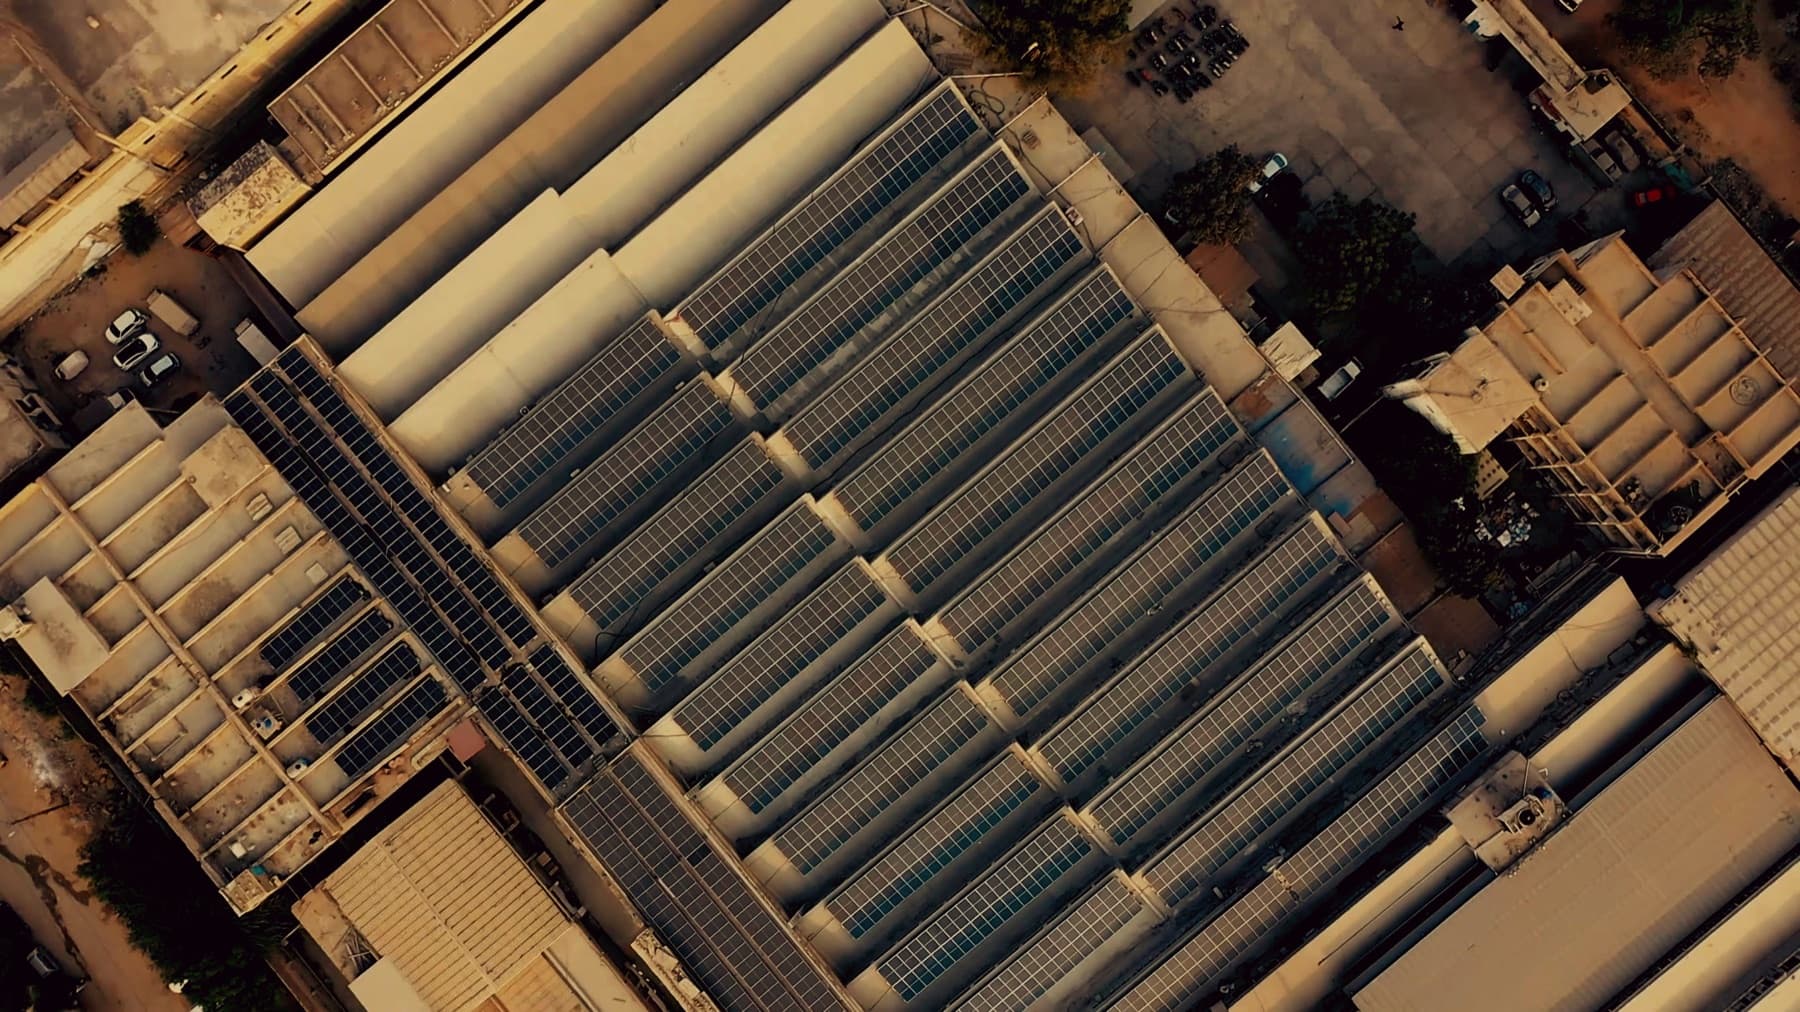
| Fleet under monitoring | 636 systems · 20.95 MW · 10 organisations · 18 brands | live systems in the portal on Sep 26, 2026; capacity corrected for unit-entry errors |
| Third-party fleets ingested | 399 systems across 4 EPC fleets | plants installed by companies other than our own, Aug 7, 2026 query |
| String readings in production | 45.8 million | database rows on Aug 7, 2026 — reading volume, not labelled faults |
| Polling cadence | fleet median 11 min; 10 min on most devices | 55,268 measured inter-reading gaps |
| Communication-fault detection | median 34 min (daytime) | n=8,250 fault episodes |
| Pipeline availability | 97.7% day-level over 131 days | includes one disclosed 3-day outage in May |
| Guardrail interventions | 1,630 events; 49% rewritten pre-send; 196 price leaks blocked | guardrail event log, 5 weeks |
| Voice notes handled | 1 in 8 leads (12.3%) | 515 of 4,198 contacts, auto-transcribed |
Definitions and windows stated per row. We'll show the queries to any serious buyer or investor — ask.
Methodology
How these numbers are kept honest.
Every figure is produced by a read-only query against the production database, and any metric that can't be reproduced that way doesn't appear on this site. The audit that established this baseline also caught a units bug — seven plants reporting watts in a kilowatts column — which had overstated raw capacity (60.1 MW summed against 19.78 MW verified at the time). The bug is fixed, ingest validation now rejects that class of error, and we publish corrections when we find them.
Limits
What we don't claim.
We do not claim predictive maintenance (our models are diagnostic today). We do not advertise a total of revenue “recovered” for customers. What the product does is attach an estimated cost per day to each problem it finds, and close a case only when the site's own output shows it is producing again (“Fixed ✓ verified”). Those are per-case estimates and checks, not a number we add up and market. The per-string dollar model is still being validated, so no dollar figure from a single string fault appears anywhere on this site. When we can't measure something, we say so.